The midterm elections are pitting the “red” versus “blue,” but how do these political parties divide in regards to housing? Realtor.com® researchers analyzed housing and demographic data in the counties that President Donald Trump and Democratic candidate Hillary Clinton each won in 2016 to find out how they differ in their real estate, like average home prices, homeownership rates, and what it takes to buy a home.
“Not only are people living in different political realities, but they’re contending with very different housing realities and paying different amounts for it,” Mark Muro, senior fellow at the Brookings Institution, a think tank based in Washington, D.C., told realtor.com®.
Trump nabbed 2,625 counties in the 2016 election compared to Clinton’s 487. Counties that went to Clinton tended to be in pricier, diverse areas and big cities, while Trump’s tended to be in inexpensive rural areas.
Populations are showing signs of shifting since then, which could play more heavily in the midterm elections. More liberal “blue” Americans are moving to conservative “red” areas. For example, Texas saw the biggest increase in new residents—a gain of about 400,000 from 2016 to 2017.
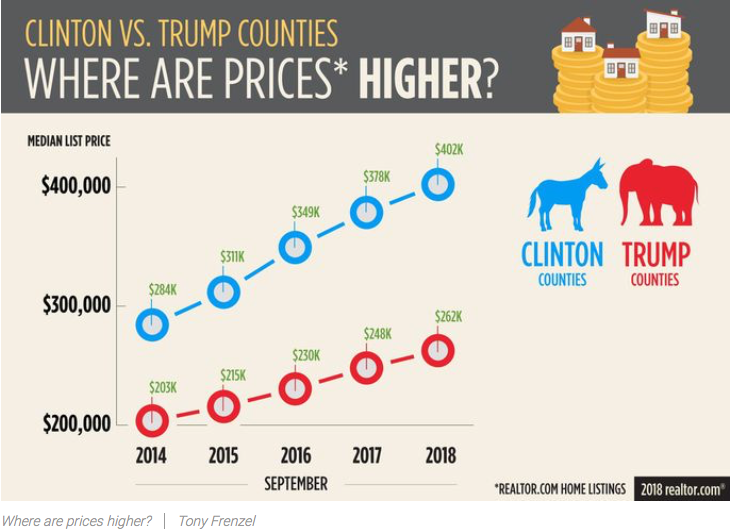
Overall, homes located in “red” counties have appreciated less than those in “blue” counties since the presidential election, realtor.com® researchers found. The median home list price was $262,612 in September in counties that voted Republican in 2016—53.1 percent lower than the $402,000 median price in counties that went Democratic, according to realtor.com®.
In Trump “red” counties, homeownership tends to be higher. “Homeownership is more affordable in Trump counties, so even with a lower income you can have a higher homeownership rate and a larger home,” says Danielle Hale, realtor.com®’s chief economist.